
Page 19 - 2024 Taiwan Health and Welfare Report
P. 19
02 | Health and Welfare Indicators
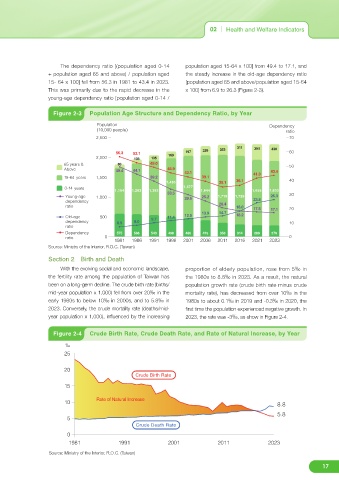
The dependency ratio [(population aged 0-14 population aged 15-64 x 100] from 49.4 to 17.1, and
+ population aged 65 and above) / population aged the steady increase in the old-age dependency ratio
15- 64 x 100] fell from 56.3 in 1981 to 43.4 in 2023. [population aged 65 and above/population aged 15-64
This was primarily due to the rapid decrease in the x 100] from 6.9 to 26.3 (Figure 2-3).
young-age dependency ratio [population aged 0-14 /
Figure 2-3 Population Age Structure and Dependency Ratio, by Year
Population Dependency
(10,000 people) ratio
2,500 70
311 394 430
253
56.3 52.1 197 229 60
2,000 103 135 169
65 years & 80 49.0 50
Above 44.9
49.4 44.1 43.4
42.1 41.3
15-64 years 1,500 39.2 39.1
1,485 35.1 36.1 40
0-14 years 1,577
1,164 1,282 1,383 1,644 1,655 1,633
33.5 30
Young-age 1,000 29.6 25.2 1,719 1,729 26.3
dependency 23.8
20.4
ratio 18.0
17.5 17.1 20
13.9 14.7
Old-age 500 11.4 12.5 18.2
dependency 6.9 8.0 9.7 10
ratio
Dependency 575 566 543 498 466 415 350 314 289 279
ratio 0 0
1981 1986 1991 1996 2001 2006 2011 2016 2021 2023
Source: Ministry of the Interior, R.O.C. (Taiwan)
Source: Ministry of the Interior, R.O.C. (Taiwan)
Section 2 Birth and Death
With the evolving social and economic landscape, proportion of elderly population, rose from 5‰ in
the fertility rate among the population of Taiwan has the 1980s to 8.8‰ in 2023. As a result, the natural
been on a long-germ decline. The crude birth rate (births/ population growth rate (crude birth rate minus crude
mid-year population x 1,000) fell from over 20‰ in the mortality rate), has decreased from over 10‰ in the
early 1980s to below 10‰ in 2000s, and to 5.8‰ in 1980s to about 0.1‰ in 2019 and -0.3‰ in 2020, the
2023. Conversely, the crude mortality rate (deaths/mid- first time the population experienced negative growth. In
year population x 1,000), influenced by the increasing 2023, the rate was -3‰, as show in Figure 2-4.
Figure 2-4 Crude Birth Rate, Crude Death Rate, and Rate of Natural Increase, by Year
‰
25
20
Crude Birth Rate
15
Rate of Natural Increase
10
8.8
5.8
5
Crude Death Rate
0
1981 1991 2001 2011 2023
Source: Ministry of the Interior, R.O.C. (Taiwan)
Source: Ministry of the Interior, R.O.C. (Taiwan)
17